
There are two types of sideswipe collisions: same direction and opposite direction. The Model Minimum Uniform Crash Criteria Guideline (MMUCC)1 defines a sideswipe collision as follows:
Sideswipe Same Direction: Two vehicles traveling in the same direction impact one another where the initial engagement does not overlap the corner of either vehicle so that there is no significant involvement of the front or rear surface areas. The impact then swipes along the surface of the vehicle parallel to the direction of travel.
(Sideswipe Same Direction from Fatality Analysis Reporting System (FARS) Coding Manual): is used when the initial engagement does not overlap the corner of either vehicle so that there is no significant involvement of the front or rear surface areas. There is no pocketing of the impact in the suspension areas as the impact swipes along the surface of the vehicle parallel to the direction of travel. There is a low retardation of force along the surface of the vehicle. This must be true for both vehicles involved in the collision.
Sideswipe Opposite Direction: Two vehicles traveling in the opposite direction impact one another where the initial engagement does not overlap the corner of either vehicle so that there is no significant involvement of the front or rear surface areas. The impact then swipes along the surface of the vehicle parallel to the direction of travel.
(Sideswipe Opposite Direction from Fatality Analysis Reporting System (FARS) Coding Manual): is used when the initial engagement does not overlap the corner of either vehicle so that there is no significant involvement of the front or rear surface areas. There is no pocketing of the impact in the suspension areas as the impact swipes along the surface of the vehicle parallel to the direction of travel. There is a low retardation of force along the surface of the vehicle. This must be true for both vehicles involved in the collision.
You may also hear sideswipe collisions referred to as lane departures, glancing blow, lane change accident and blind spot accident.
STATISTICS
In a data collection project conducted by NHTSA and FMCSA, the 2006 Large Truck Crash Causation Study (LTCCS) site same direction sideswipe collisions as the third leading cause of serious large truck crashes at 10.3%. Opposite direction sideswipes were determined to be the 7th leading cause of large truck crashes at 4.6%.
Table 4 – Estimated Number of Trucks in Crashes by Crash Type
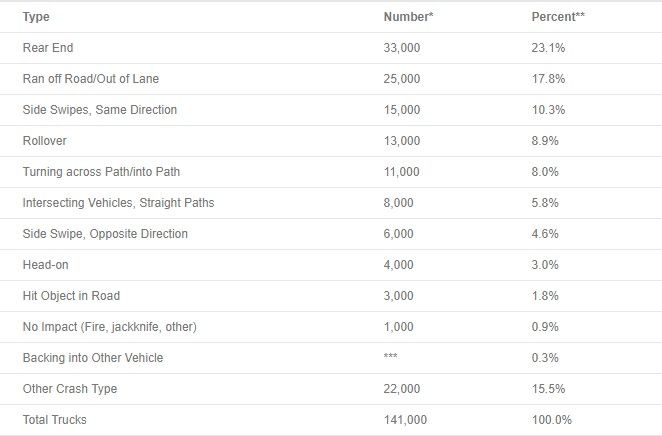
Notes:
*Numbers rounded to closest 1,000.
**Percent calculated on unrounded estimates.
***Weighted numbers lower than 500 are rounded to zero.
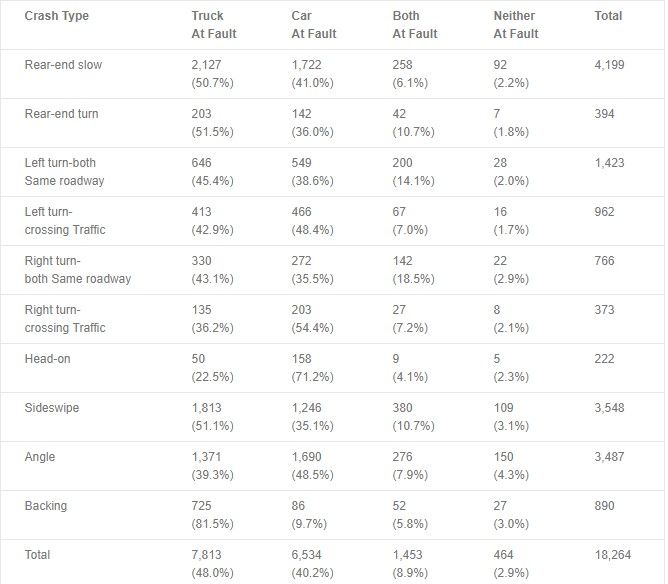
In a much earlier study by the Highway Safety Information System (HSIS) entitled, Summary Report: An Examination of Fault, Unsafe Driving Acts and Total Harm in Car-Truck Collisions, researchers used the North Carolina database in the Highway Safety Information System to study data from 1994-1997. The objective of this study was, as the title indicates, to present statistics that indicated who was at fault in car-truck collisions by crash type. While their study does not break down sideswipe collisions by same direction and opposite direction, their findings indicated that the truck was at fault in 51.1% of sideswipe cases.
Table 2. Fault for truck and car drivers by crash type
(North Carolina car-truck crashes, 1994-97)
Of additional importance, is data released by the National Highway Traffic Safety Administration (NHTSA) in March 2003 in their report entitled, “Analysis of Lane Change Crashes.”
This report is based on data from the 1999 National Automotive Sampling System/General Estimates System (GES) crash database of the National Highway Traffic Safety Administration. Lane change crashes are defined in this report as two-vehicle crashes that occur when one vehicle encroaches into the path of another vehicle initially on a parallel path with the first vehicle and traveling in the same direction.
Approximately 539,000 two-vehicle lane change crashes occurred in the U.S. in 1999 or about 9% of all police-reported motor vehicle crashes. Ten percent of “typical lane change” crashes involved large trucks changing lanes and light vehicles going straight, about 5% of these crashes involved the reverse combination. The highest involvement of trucks was observed in the “merging” scenario, accounting for 42% of these crashes.
CAUSES OF SIDESWIPE COLLISIONS
The most common cause in sideswipe collisions, where the truck driver is at fault, include the following or a combination of the following:
- Driving too fast for weather conditions, road conditions or traffic conditions
- Overreaction to road hazard
- Trying to avoid a collision with another vehicle
- Blind sports, not checking mirrors
- Unsafe lane change due to driver distraction
- Fatigue or drowsiness
- Aggressive driving
- High crosswinds
- Truck malfunctions including brake failure, wheel or tire failure and cargo shift
An additional causation for sideswipe collisions involves conspicuity issues. In dark, non-lit areas, a trailer may not be clearly visible. A study was performed by the National Highway Traffic Safety Administration (NHTSA) to evaluate the effectiveness of retroreflective tape in enhancing the visibility of heavy trailers and reducing side and rear impacts by other vehicles during dark conditions. The study is based on the analysis of 10,959 crash cases investigated by the Florida Highway Patrol and the Pennsylvania State Police in 1997-1999. Their report entitled, The Effectiveness of Retroreflective Tape on Heavy Trailers, was released March of 2001. The outcome of this study concluded that retroreflective tape was quite effective. It reduced side and rear impacts into trailers, in dark conditions (including “dark-not-lighted,” “dark-lighted,” “dawn,” and “dusk”) by 29 percent. More notably, in “dark-not-lighted” conditions, the tape reduced side and rear impact crashes by 41 percent. The study found the tape is especially effective in reducing injury crashes. In dark conditions, it reduced side and rear impacts that resulted in fatalities of injuries to drivers of any vehicle, by 44 percent.
While a sideswipe collision with a large truck can be significantly damaging to the passenger vehicle involved, oftentimes, the subsequent collision results in catastrophic damage. When a passenger vehicle is sideswiped by a large truck, the driver often loses control of the vehicle and a subsequent collision occurs with one or more of the following: additional vehicles, median barriers, guardrails, light posts, road signs, and trees. When loss of control results in leaving the roadway, a subsequent rollover may occur. A sideswipe collision can also result in a deadly underride event, where a vehicle is positioned at least partially underneath a large truck during the crash. (I won’t go into detail on side underride cases, as this was previously addressed by Valerie Yarashus.)
PREVENTABILITY
While statistics are valuable in analyzing the prevalence and cause of a sideswipe collision, the next logical focus in on preventability.
The FMCSA provides resources to assist motor carriers in identifying preventable accidents by drivers and motor carriers. One such resource is “A Motor Carrier’s Guide to Improving Highway Safety (December 2009).” Section Four of this guide provides guidelines for determining if an accident was preventable, by accident type and countermeasures designed to reduce preventable accidents.
While the FMCSA acknowledges that each accident must be judged and evaluated individually, it provides these guidelines that pertain to sideswipe collisions:
Sideswipe and Head-on Collisions
Preventable if:
- Driver was not entirely in his/her proper lane of travel
- Driver did not pull to right and slow down or stop for vehicle encroaching on his/her lane of travel when such action could have been taken without additional danger
Accidents While Being Passed
Preventable if:
- Driver failed to stay in his own lane and hold speed or reduce it to permit safe passing
All Types of Accidents
Preventable if:
- Driver was not operating at a speed suitable for the existing conditions of road, weather and traffic
- Driver failed to control speed so that he/she could stop within assured clear distance
- Driver misjudged available clearance
- Driver failed to yield right-of-way to avoid accident
- Driver failed to accurately observe existing conditions
- Driver was in violation of company operating rules or special instructions, the regulations of any Federal or State regulatory agency, or any applicable traffic laws or ordinances.
Further research initiated by the FMCSA, focusing on safety technology, was released in October 2013. The Onboard Safety Systems Effectiveness Evaluation Final Report evaluated the effectiveness of deployed onboard safety systems (OBSS), specifically lane departure warning (LDW), roll stability control (RSC), and forward collision warning (FCW) systems.
The data obtained from 14 participating motor carriers was evaluated to answer three specific research questions: 1) What are the safety benefits, i.e., reduction in the number of crashes, of LDW, RSC and FCW systems pertaining to the specific crash types associated with each OBSS?; 2) Are these OBSSs cost effective investments, e.g., what are the economic costs and benefits associated with adoption of each OBSS?; and 3) What are drivers’ and safety managers’ opinions and perceptions regarding each OBSS type?
The methodology employed for this study used carrier crash records for analysis. Carriers often have more stringent crash reporting requirements than the USDOT-reportable crashes and they include more minor incidents as well. Furthermore, this study was able to account for exposure in crash rate analysis based on vehicle miles traveled, or crashes per million vehicle miles traveled (MVMT). Five years of crash data from 2001 to 2005 in the General Estimates System (GES) were used to estimate the average annual numbers of crashes preventable by each of the three different systems.
LANE DEPARTURE WARNING SYSTEM EFFECTIVENESS
For purposes of this presentation topic, highlights of study outcomes related to lane departure warning systems (LDWS) will be provided.
A lane departure warning system (LDWS) is a device that uses visual sensors to detect lane markers ahead of the vehicle. LDWS detects when a driver is encroaching on a lane marking such as a solid line, dashed line or raised reflectors. When this occurs and the turn signal is not activated, a warning is emitted alerting the driver to make a correction. LDWS also warns drivers when lane markings are inadequate for detection and if the system malfunctions. Of note is the driver’s ability to temporarily disable this feature.
The LDWS effectiveness analysis resulted in a statistically significant finding whereby trucks without LDWS had a LDW-related crash rate (per MVMT) 1.917 times higher than trucks with such a system. This reduction translates to a 47.8 percent crash rate reduction per MVMT in LDW-related crashes with the use of a LDW. This finding is on the high end of the range (23% to 50%) predicted in previous research studies that also assessed the effectiveness of LDWS.
The benefit-cost analysis included the technology purchase, maintenance costs and the cost of training drivers in the use of the technology. Purchasing technology with or without financing was included in the costs analysis, as was Federal tax savings due to the depreciation of the equipment. The total costs ranged from $765.00 to $866.40 per vehicle. Combined with the carrier crash avoidance benefits, the LDWS benefits to the carriers outweigh the costs by a factor (benefit-to-cost ratio or BCR) of 14.69 to 4.95 (depending on annual vehicle miles traveled [VMT]), implying a payback period of 4 to 12 months. The LDWS benefits to society would outweigh the costs by a factor of 5.7 to 1.9 (depending on annual VMT), implying a payback period of 11 to 32 months.
The benefit costs analyses were based on the assumption that all crash costs in the specified categories would be incurred by self-insured, large-sized motor carriers or those carriers with insurance deductibles at or above total crash costs. Thus, the study also included a sensitivity analyses that focused on smaller carriers. It was important to consider smaller carriers separately from larger carriers, given the differences in financial and operating costs. Smaller carriers are unlikely to be self-insured, resulting in a much lower out-of-pocket cost per crash. The sensitivity analyses revealed, based on the overall probability of involvement in crashes, smaller carriers that utilize lower deductibles, such as $5,000 per truck, may not achieve a break-even point (a dollar or more of benefits for each dollar spent on financing the technology) in the first five years. However, as the number of crashes and/or severity of crashes increase, insurance premium costs typically increase until the carrier’s insurance costs equal or exceed the investment costs of the technology or the carrier is altogether dropped by the insurance provider. Therefore, an investment in safety technology may still be considered judicious for added protection against rising insurance costs for carriers that are not self-insured.
NEGLIGENCE
Was the tractor-trailer involved in your case equipped with a lane departure warning system? Based upon the merits and liquidity of your case, exploring an additional cause of action may be imperative. Negligent entrustment also includes instrumentality or the tractor-trailer. A motor carrier must be diligent in providing a safe, well-maintained vehicle for operation. Through additional discovery, a clear picture can be created that discloses the trucking company’s lack of diligence in deploying safety technology that has clearly been proven to substantially decrease the risk of collision. This lack of due diligence in failure to employ the safest technology available not only impacts the crash in question but signifies fleet-wide negligence.
1The Model Minimum Uniform Crash Criteria Guideline (MMUCC) is a minimum, standardized data set for describing motor vehicle crashes and the vehicles, persons and environment involved. The Guideline is designed to generate the information necessary to improve highway safety within each state and nationally. This data set, originally published in the MMUCC Guideline, 1st Edition (1998), has been revised three times, most recently in the 4th Edition (2012), in response to emerging highway safety issues.
Some of America’s foremost authorities on highway safety have worked together to develop and update MMUCC since the first edition of the Guideline was released in 1998. The program is funded by the National Highway Traffic Safety Administration (NHTSA), and jointly managed by NHTSA and the Governors Highway Safety Association (GHSA) with input from other offices in the U.S. Department of Transportation.